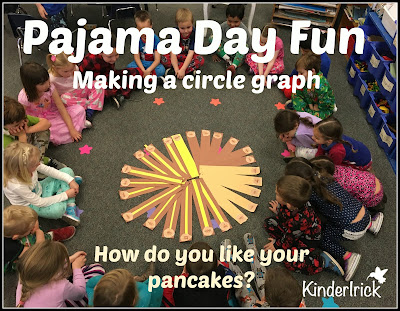
Each year my school has a pajama day. This is the parents most favorite day as they don't have to argue with kids about clothes or breakfast. The kids love it because it's fun to wear their PJs to school. I like seeing the kids so excited for the day and I like all the fun activities that we do, but quite frankly, I don't like wearing my pajamas to school, but I'm a team player so I do it with a smile.
On pajama day we cook pancakes in my classroom. The kids try them different ways, plain, with butter, with syrup and with butter & syrup. Kids decide which way is their favorite and then we graph the results.
First we lay out the strips making a bar graph. This is a very easy way to interpret the data.
After that we put the strips in a circle to make a pie chart. It's a different way of looking at the data and a lot of fun to see how it all breaks down. By using a pie chart you can see the percentages of how the data breaks down. We figured out that half of the class likes their pancakes with both syrup and butter. Yum!


0 comments:
Post a Comment